
While I discussed the great benefits of Squarespace metrics a few weeks ago, their analytics only cover the basics. If you want to go beyond the simple data and have a better understanding of exactly what your visitors are doing on your site, Google Analytics is an extremely useful tool. Today I'm taking you behind the screen to show you how to install Google Analytics and help you understand its data.

How to Set Up Google Analytics
Visit the Google Analytics home page, create an account, and enter your account name, your website's name, and your URL.
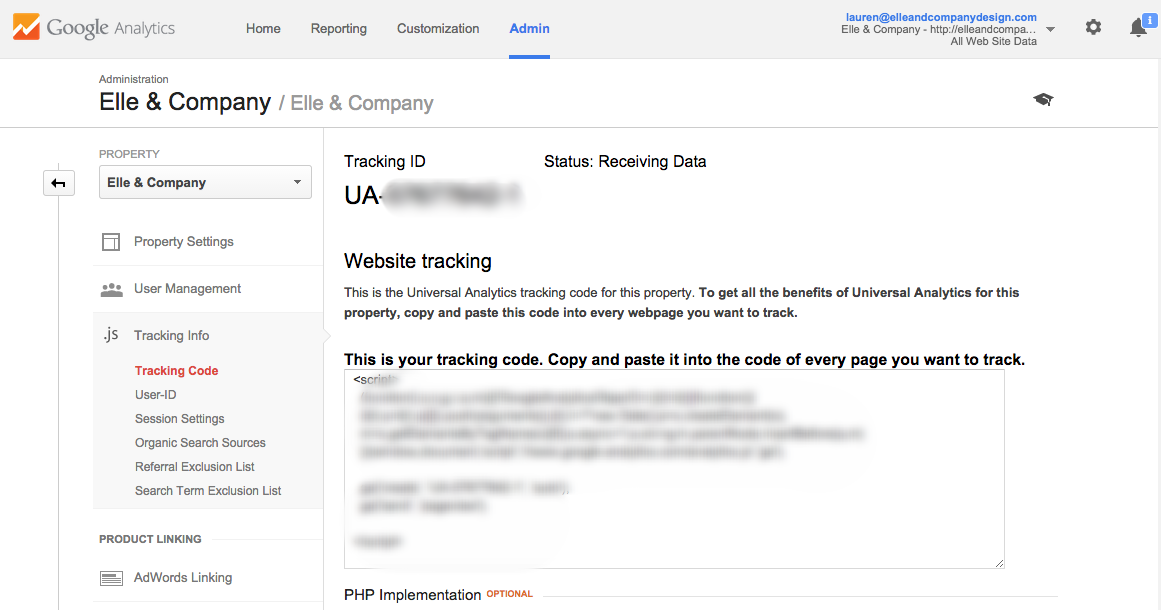
In the lefthand side of your screen, you will see an option labeled Tracking Code under the User Management category. At the top of the page you will see an ID number that begins with UA-XXXXXXXX-X. This number is the code that connects your account with your website, and the next step is to embed this into your website.
For Squarespace users, this is very easy to do. Simply go into the backend of your website and click Settings in the main menu.

Next, select the Advanced tab at the bottom of the menu and choose the External Services option.
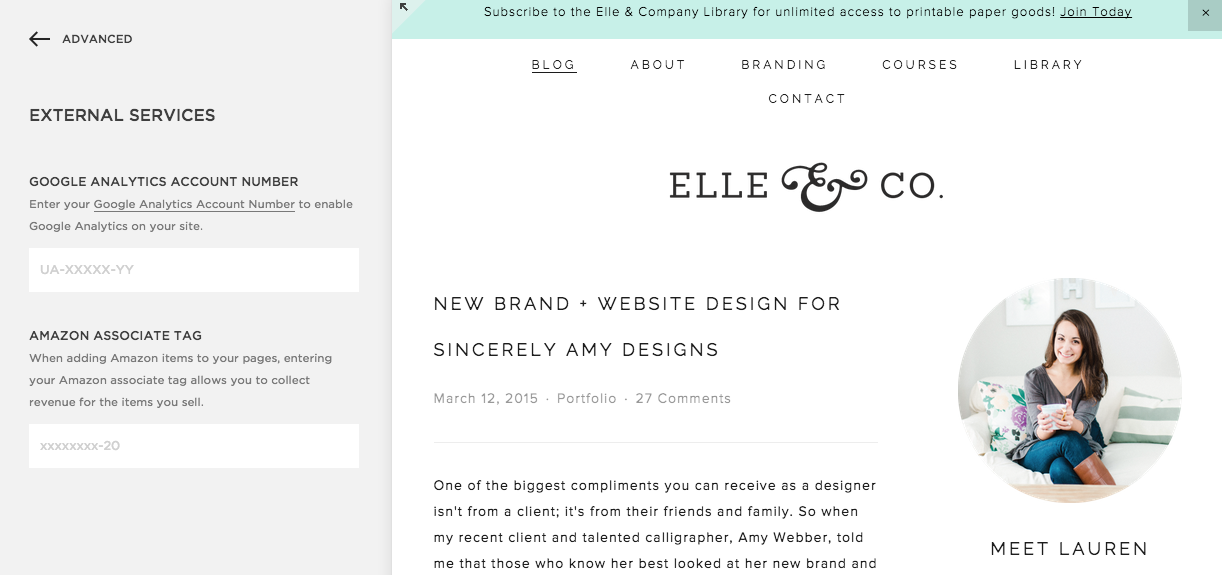
In the section at the top labeled Google Analytics Account Number, enter the UA code and save your changes. And that's it! You're all set up and ready to go with Google Analytics. It's important to note that although you have successfully installed Google Analytics onto your website, it usually takes 24 hours before the statistics will begin to show up on your Google Analytics account.
For those of you using Wordpress, I highly recommend looking into a plugin to install Google Analytics. Yoast has good reviews and seems to have the best plugins for Analytics and SEO. Here is a link to the Yoast Google Analytic plugin. If you're still stuck, visit this helpful guide on how to install Google Analytics in Wordpress.
How to Read Your Analytics
Now that you're all set up, it's important to know what you're viewing. Here is an overview of the most helpful reports for measuring the effectiveness of your content.
Audience Overview
This is the most basic report; it gives a very general outline of what happened on your site over a specified period of time. Jake and I check this report a couple times each day to gauge the response of Elle & Company readers to a blog post. While it doesn't go into too much detail, it provides a basic overview at a glance.
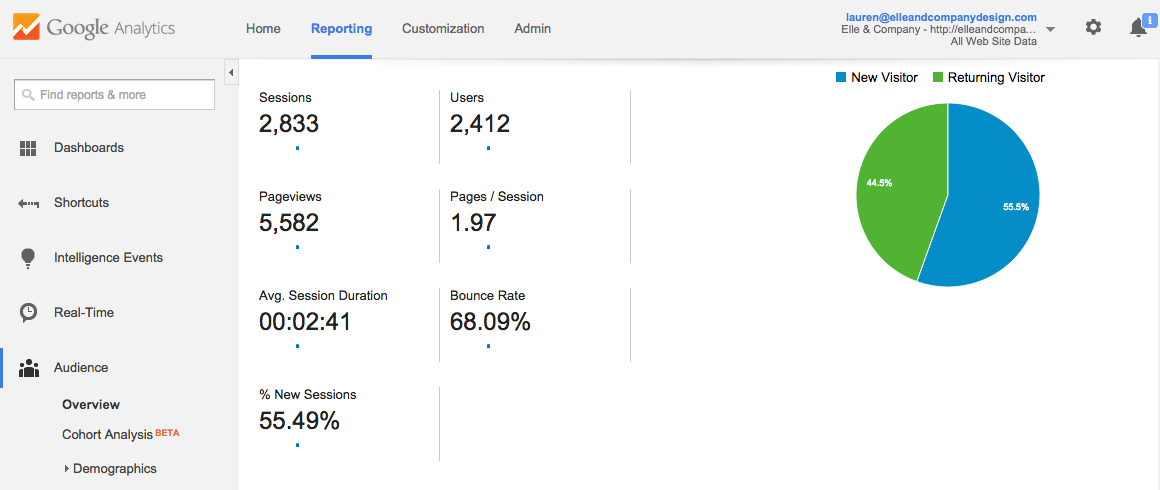
Sessions - This number represents the total number of times your site was visited over a certain time period. This number includes repeat visitors.
Users - This is the total number of people that visit your site over a specified time period.
Pageviews - This number represents the total number of pages that were visited by users over a certain time period.
Avg. Session Duration - The average length of time that each visitor remains on your site.
Bounce Rate - The percentage of visitors who navigate away from your website after landing on your home page. Essentially, this is the percentage of visitors that only viewed one page on your website.
% of New Sessions - The percentage of people who are visiting your site for the first time.
If you want to see your site's analytics over another time period or date, you can easily change the date in the upper righthand corner of the screen and click Apply.
Real-Time Overview
This report tells you how many people are on your site at any given moment. It's useful for many reasons, but at Elle & Company, we like to use this data to analyze our social media click-through rates, particularly for Instagram. Because Instagram click-through rates are difficult to measure, I I will often encourage followers to visit the Elle & Company site in the description of my Instagram photo. After I've posted the image, Jake and I sometimes pull up the Real-Time Overview to see if there is a spike in real-time visitors.
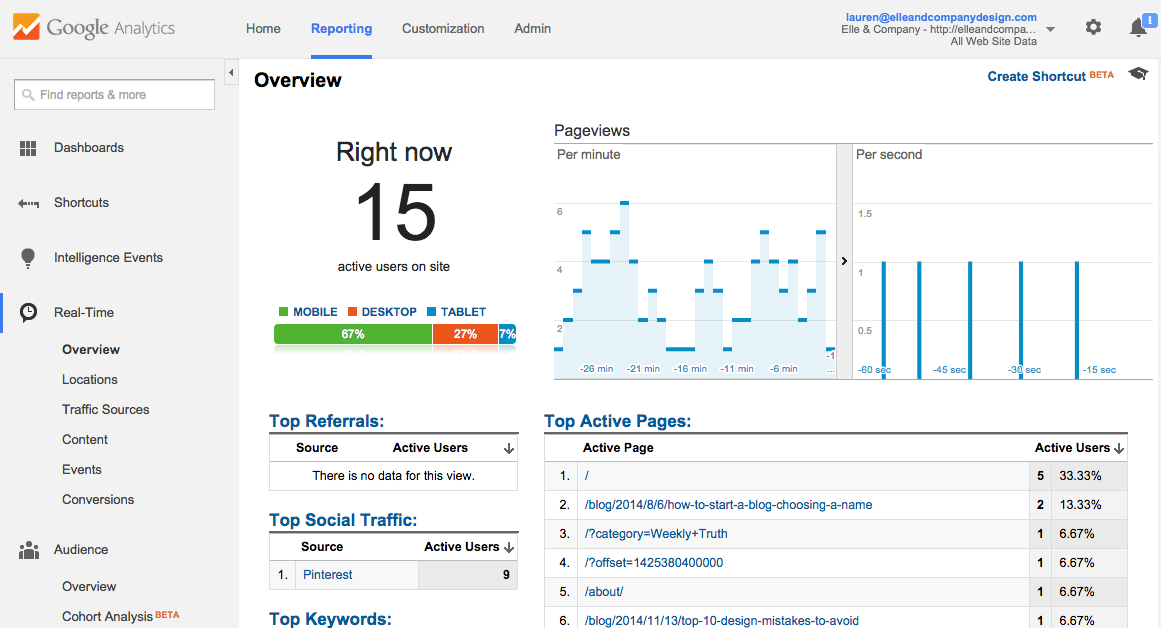
A real-time report is an area where Squarespace Metrics are lacking, and it can be very useful to observe these statistics when you're trying to decipher how much traffic you're receiving at a particular time.
Acquisition Overview Report
This report shows you where your site's traffic is coming from, and it typically breaks it down into four categories: Social, Direct, Referral, and Organic search.
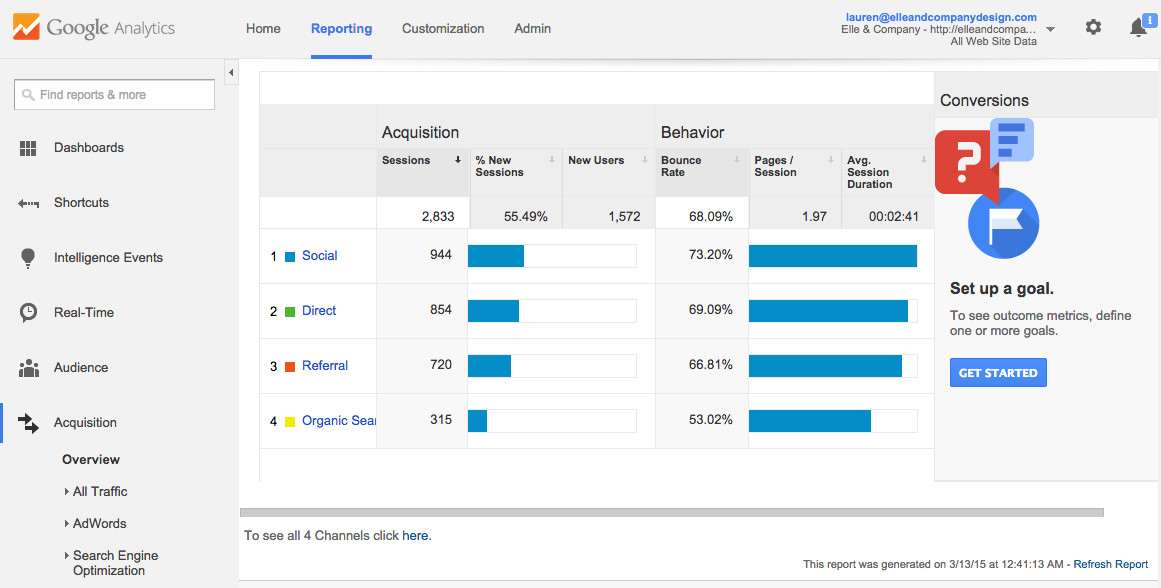
Social - The number of click-throughs on your site from social media. (This doesn't include Instagram; those are counted as direct click-throughs because they take you through a web browser like Safari.)
Direct - This number refers to the number of people who simply type your URL into their browser and visit your site directly.
Referral - This category refers to sites that have directly linked to your site, referring traffic to you. Being able to view those who are linking to you allows you to network by visiting their site, leaving a comment, sharing the post on social media, etc.
Organic Search - This report shows you how people are discovering your website through search engines. By viewing this data, you have the ability to see which keywords you should be focusing on and using more often in order for a greater number of people to come across your site.
If you're trying to understand your readers and get a more in depth look at their actions on your site, Google Analytics is an extremely useful tool. This is just the tip of the iceberg with all of the information that you can uncover by using Google Analytics, but these 3 reports will be helpful for getting started!
For checking your stats on the go, be sure to download the Google Analytics app.
Do you use Google Analytics? Which reports do you view the most?


